





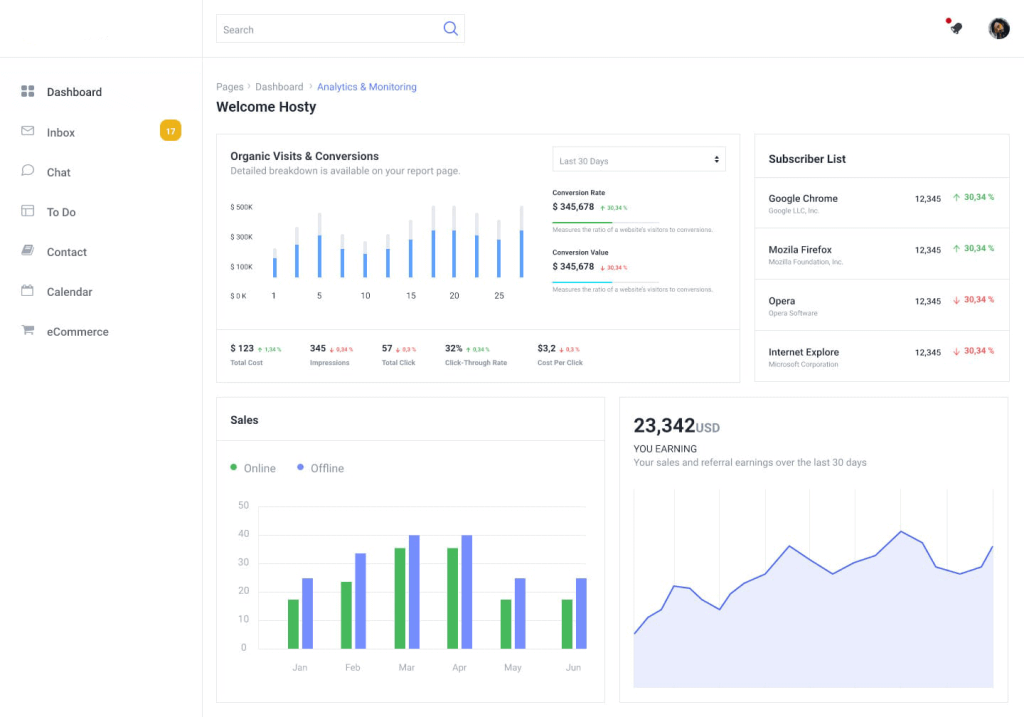


Who We Are
Databloid1 was founded by a data consultant with a passion for making sense of messy spreadsheets and obscure reports. After years of watching organizations get stuck with dashboards that made simple insights feel impossible to find, wasting time and missing real opportunities, we recognized the need for a different approach. Databloid builds storytelling dashboards that make sense. We turn data into stories.
What We Do
Your data has so much potential—and we’re here to help you tap into it. Whether you’re just getting started or looking to make what you already have work better, we’ll meet you exactly where you are and help you take the next step forward. No matter what stage you’re at, we’ve got your back.
Data Consulting
We handle the full spectrum of data work—from cleaning and transforming data to building solid repositories, summarizing key findings, and turning rows and columns into meaningful insights. We take the time to understand your unique challenges and work alongside you to explore the best-fit solutions.
Custom Dashboard Development
We love creating dashboards that tell a story and spark insights. That might mean building custom Pivot Reports2 in Excel that align with your team’s workflow, modeling KPI dashboards in Tableau3 to track what matters most, or guiding you through the leap from static CSV files to dynamic, cloud-based platforms like Power BI4.
Report Automation
Imagine getting your reports automatically—daily, weekly, monthly, or whenever you need them—without lifting a finger. We’ll set up automated reporting that works seamlessly with your existing tools like SAS5, SQL6, and Windows Task Scheduler, so you can focus on what matters most to your business.
Performance Tuning
Get insights quicker—nobody has time for sluggish queries. We’ll optimize your SAS or SQL, so your systems run more efficiently, and IT budget breathes easier. Because when your data flows smoothly, your team can focus on making decisions instead of waiting for data to be available.
Why Choose Databloid
Turn data chaos into clear insights
Data should help you. At Databloid, we believe clarity wins. We take the time to understand your unique needs, ask the right questions, and collaborate with you every step of the way. No jargon, no cookie-cutter templates—just thoughtful solutions built around how you and your team work. We love those “Aha!” moments when everything suddenly clicks.
Your data tells a story, but are you hearing it? We help technical, operational, and executive leaders transform overwhelming information into strategic advantages that drive sustainable growth, turning analysis paralysis into decisive action.
- Databloid, a blend of data and tabloid. Because your data has a story, and we’re giving it a headline. ↩︎
- Pivot Reports, often created using pivot tables, is a dynamic data analysis tool that summarizes and reorganizes data from a larger dataset, allowing for quick insights and custom reports. ↩︎
- Tableau, a business intelligence acquired by Salesforce, is a visual analytics platform that empowers people and organizations to make the most of their data. ↩︎
- Power BI, a business intelligence developed by Microsoft, is a collection of software services, apps, and connectors that work together to turn your unrelated sources of data into coherent, visually immersive, and interactive insights. ↩︎
- SAS software is a comprehensive suite developed by SAS Institute for data management, advanced analytics, multivariate analysis, business intelligence, and predictive analytics. ↩︎
- SQL, which stands for Structured Query Language, is a domain-specific programming language used for managing and manipulating data stored in relational databases. ↩︎
- The SMART framework was proposed by George T. Doran. The acronym SMART stands for Specific, Measurable, Achievable, Relevant, and Time-bound. ↩︎
- The GOOD mindset is a visual framework at Databloid. The acronym GOOD stands for Growth-focused, Outcome-driven, Objective-led, and Data-informed. ↩︎